Cost Analysis
The Cost Analysis section plays a crucial role in the Identity Management and Store system. It allows users to monitor and analyze their spending on various services and products related to their projects or accounts. This feature is especially important for users who need to keep track of costs, optimize their budgets, and ensure they are not exceeding financial limits.
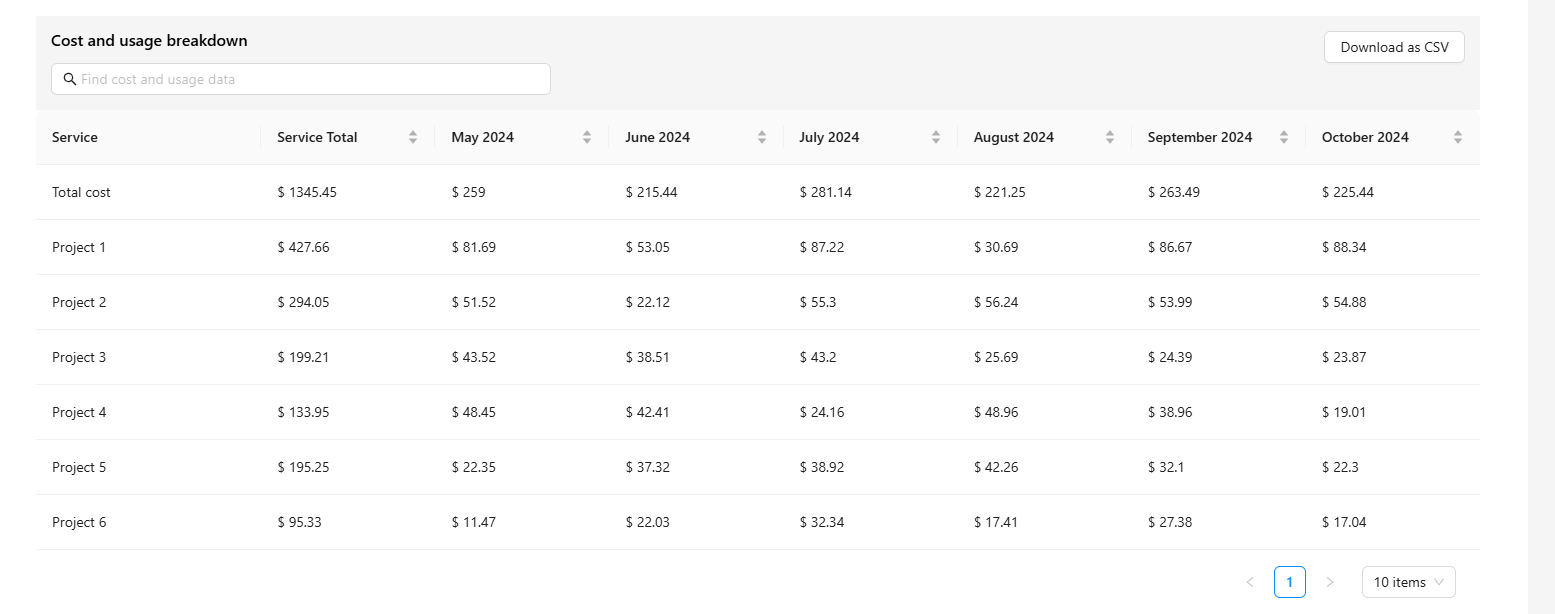
1. Cost Breakdown
- The Cost Analysis section provides a breakdown of costs by each individual project. Each project within the system will have its own cost report, which includes all charges associated with it. These charges might include subscription fees, service usage, extra charges for overages, and any other billing related to the project.
- Users can view the total expenditure for each project over a specific period (hourly, daily or monthly) and analyze the cost trends for better budgeting and cost control.
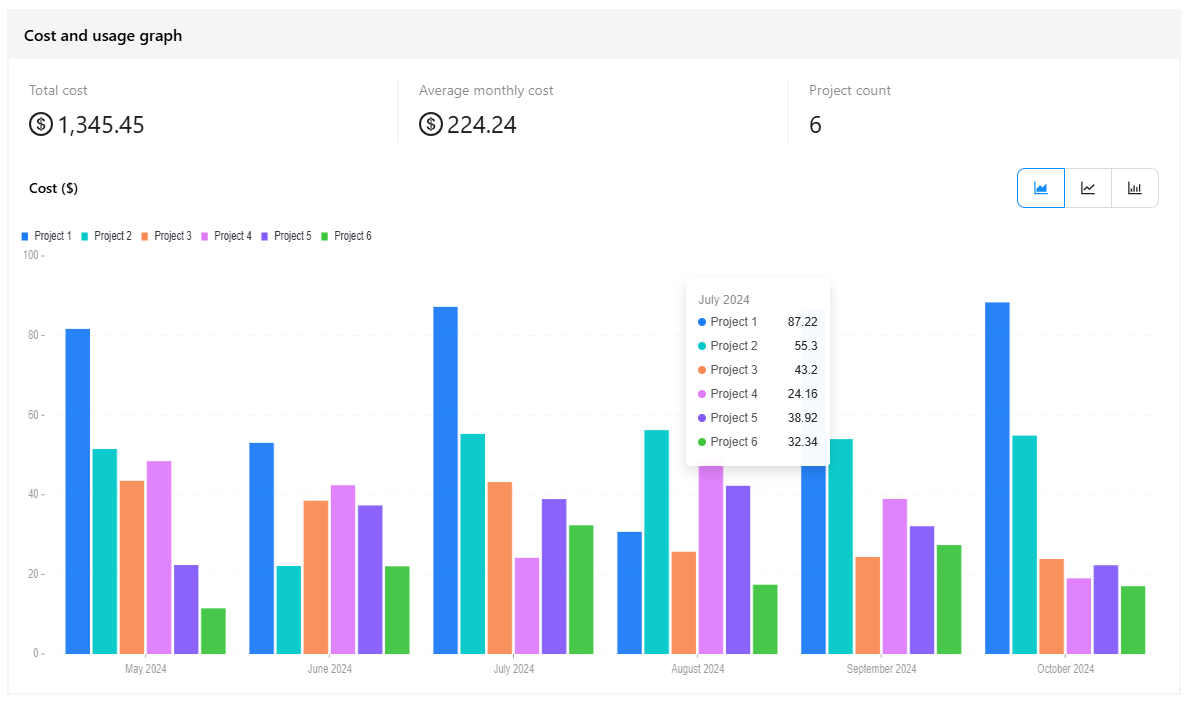
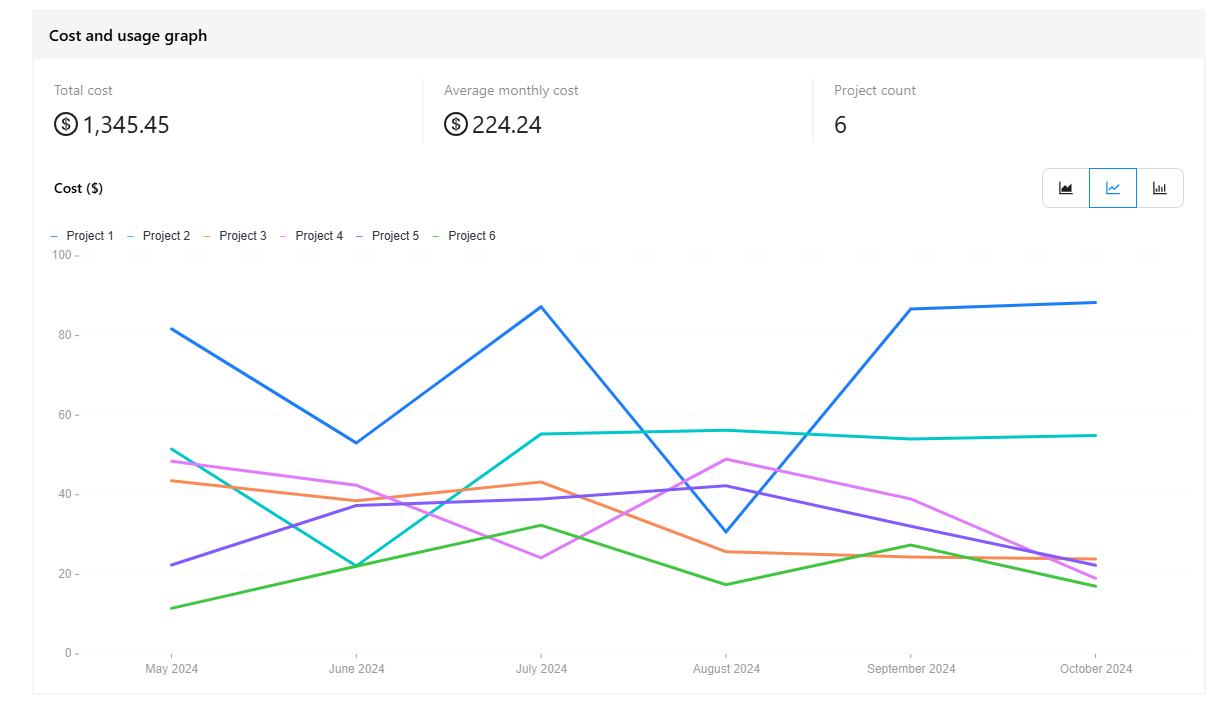
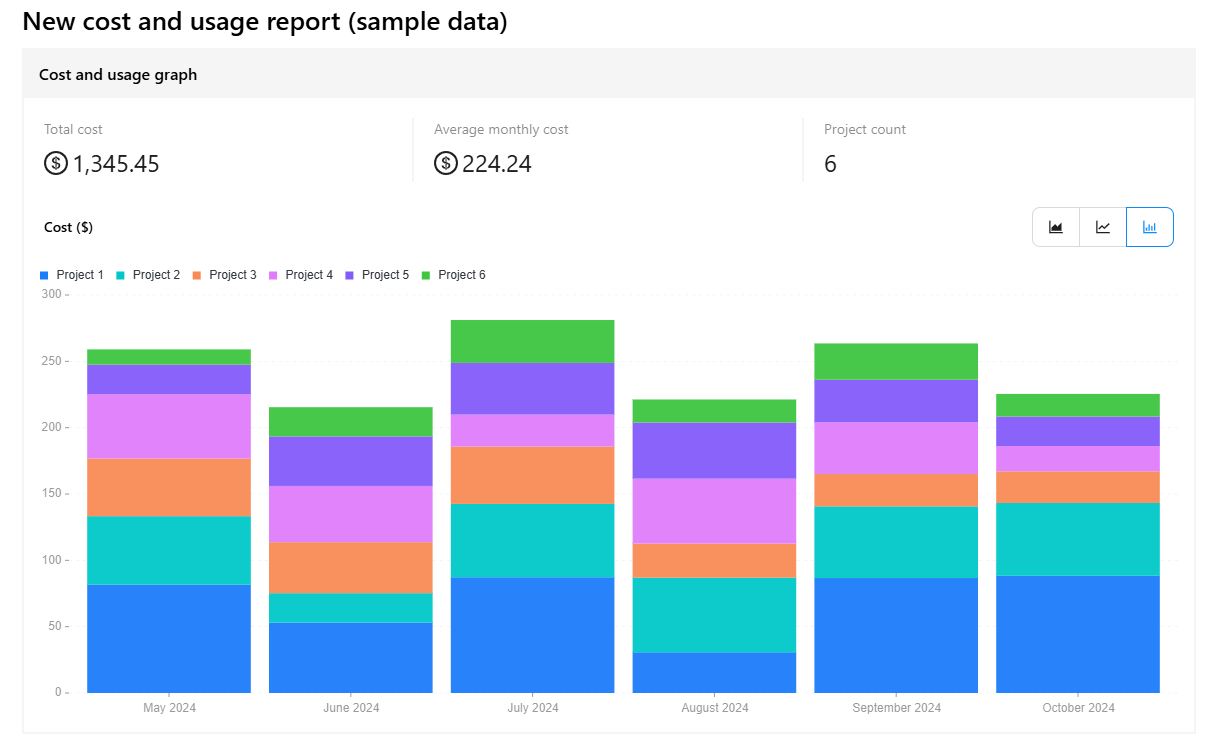
2. Interactive Graphs and Charts
- The Cost Analysis feature includes various graphs and charts that visually represent the spending trends. These graphs can help users identify patterns and see at a glance where most of their costs are coming from.
- Some common types of charts might include bar graphs, pie charts, and line graphs. These charts provide a visual comparison of costs across different parameters such as providers, devices, functions, and more.
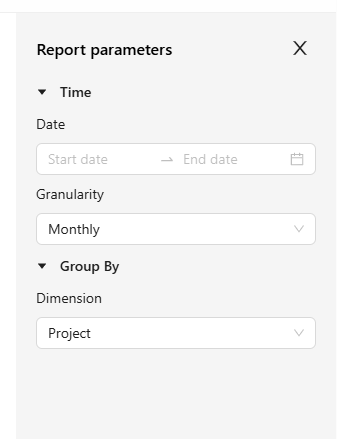
3. Filters and Customization
-
Users can apply filters to narrow down the cost analysis based on different parameters, such as:
- Provider: Analyze costs associated with specific service providers.
- Devices: See which devices or hardware are generating the highest expenses.
- Function: Track costs associated with specific functions or features being used within the project.
- Date Range: Filter data by specific periods such as the current day, week, month, or custom date ranges.
- Time of Day: Analyze costs during specific hours of the day or periods of time.
-
These filters allow users to dive deeper into the data, gaining insights into specific areas that might need attention or optimization.
4. Export Data
- Users may also have the option to export their cost data into CSV. This feature is particularly useful for generating reports or sharing cost analysis with teams, stakeholders, or finance departments.